AIS Explorer
Live AIS vessel traffic rendered as a real-time 3D globe against real terrain and bathymetry, with port activity, historic tracks, and seabed context around the UK Continental Shelf.
Overview
AIS (Automatic Identification System) is a maritime technology developed for collision avoidance, requiring ships to broadcast their identity, position, course, and speed over radio in real time. Because these broadcasts are open and unencrypted, they can be picked up by anything from commercial port authority infrastructure and satellites to low-cost consumer-grade receivers. This openness, which makes AIS a professional navigation and logistics tool, also makes it a genuine open-source intelligence (OSINT) resource, letting anyone track vessel movements without needing privileged access to any single operator's data.
AISStream.io provides a stream of this open data, derived from a community network of independent, often hobbyist-operated terrestrial VHF receivers. Coverage follows wherever someone has put an antenna, and although the coverage can be patchy, it provides an ideal AIS data source for prototyping and developing digital solutions for marine domain awareness and intelligence.
AIS Explorer is built on a live 3D globe that transforms AIS data into an interactive view of real-world vessel traffic, history, and maritime activity. Beyond vessel tracking, it integrates vessel history, port-activity analytics, and marine infrastructure context, transforming a raw AIS feed into a genuine picture of what's happening at sea.
It also draws in data from OpenSSDM, a system for ingesting and managing seabed survey data built on an industry-standard, widely recognised data model. OpenSSDM brings seabed context into the picture, adding high-resolution seabed terrain scans and survey data, standardised into a common representation that captures the dynamic conditions beneath the surface. It adds a new dimension to marine domain awareness, supporting practical applications like seabed hazard avoidance, dredging, and channel management.
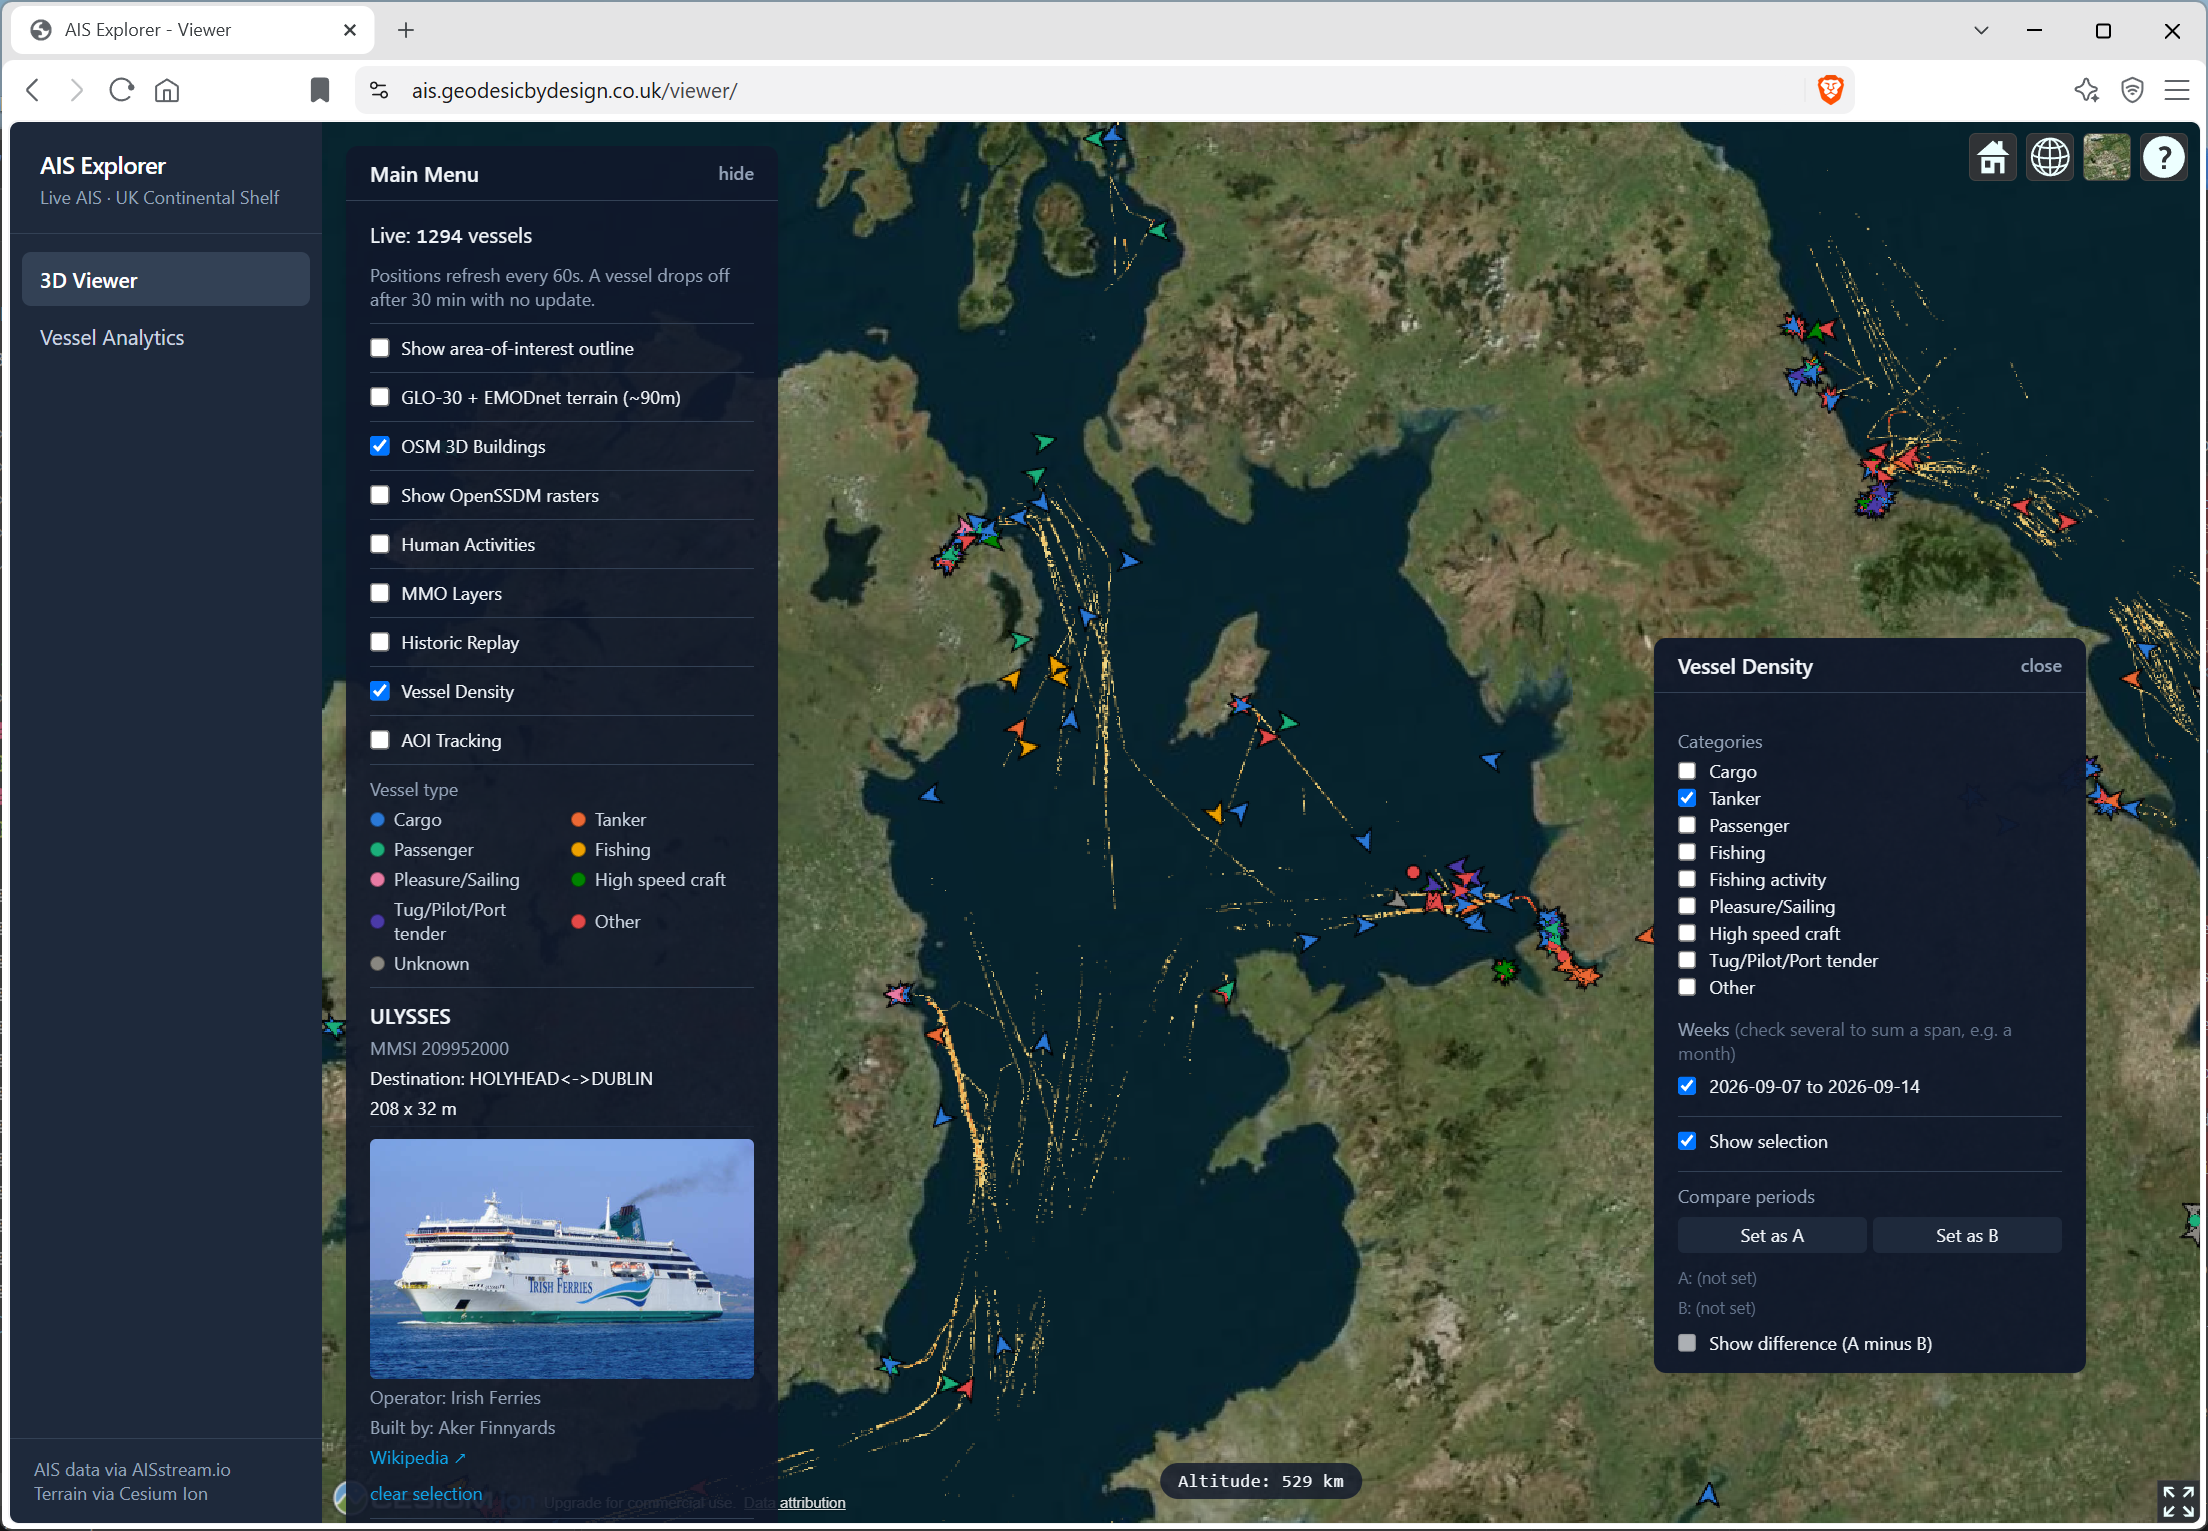
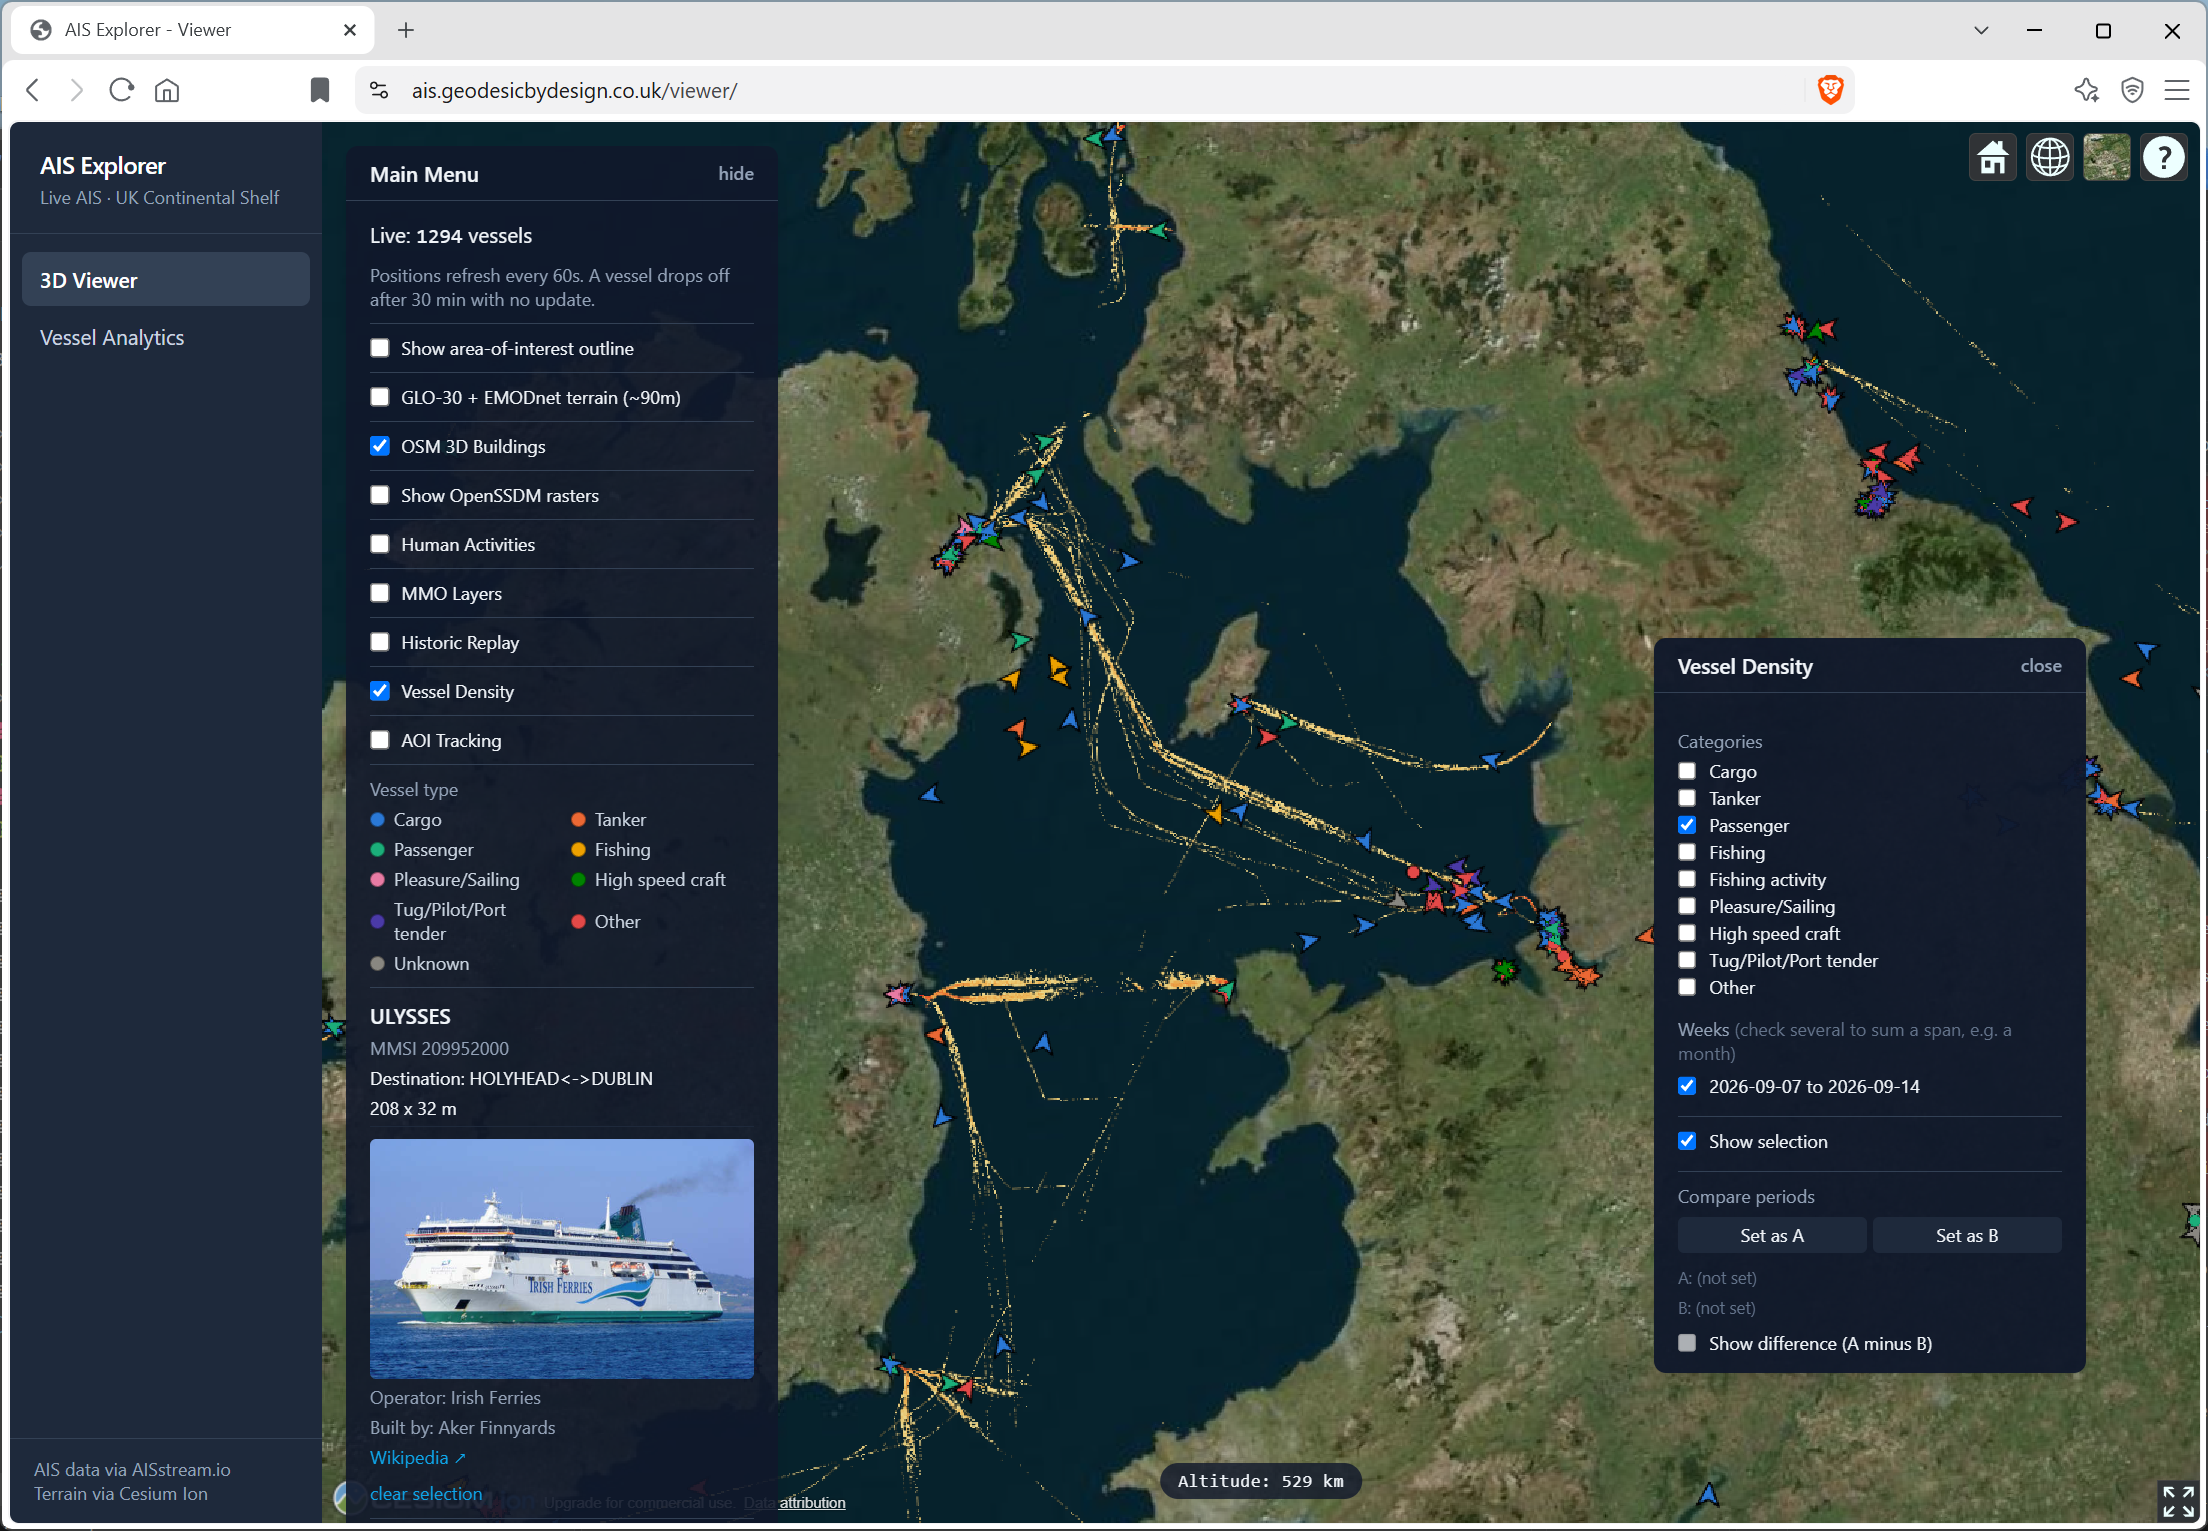
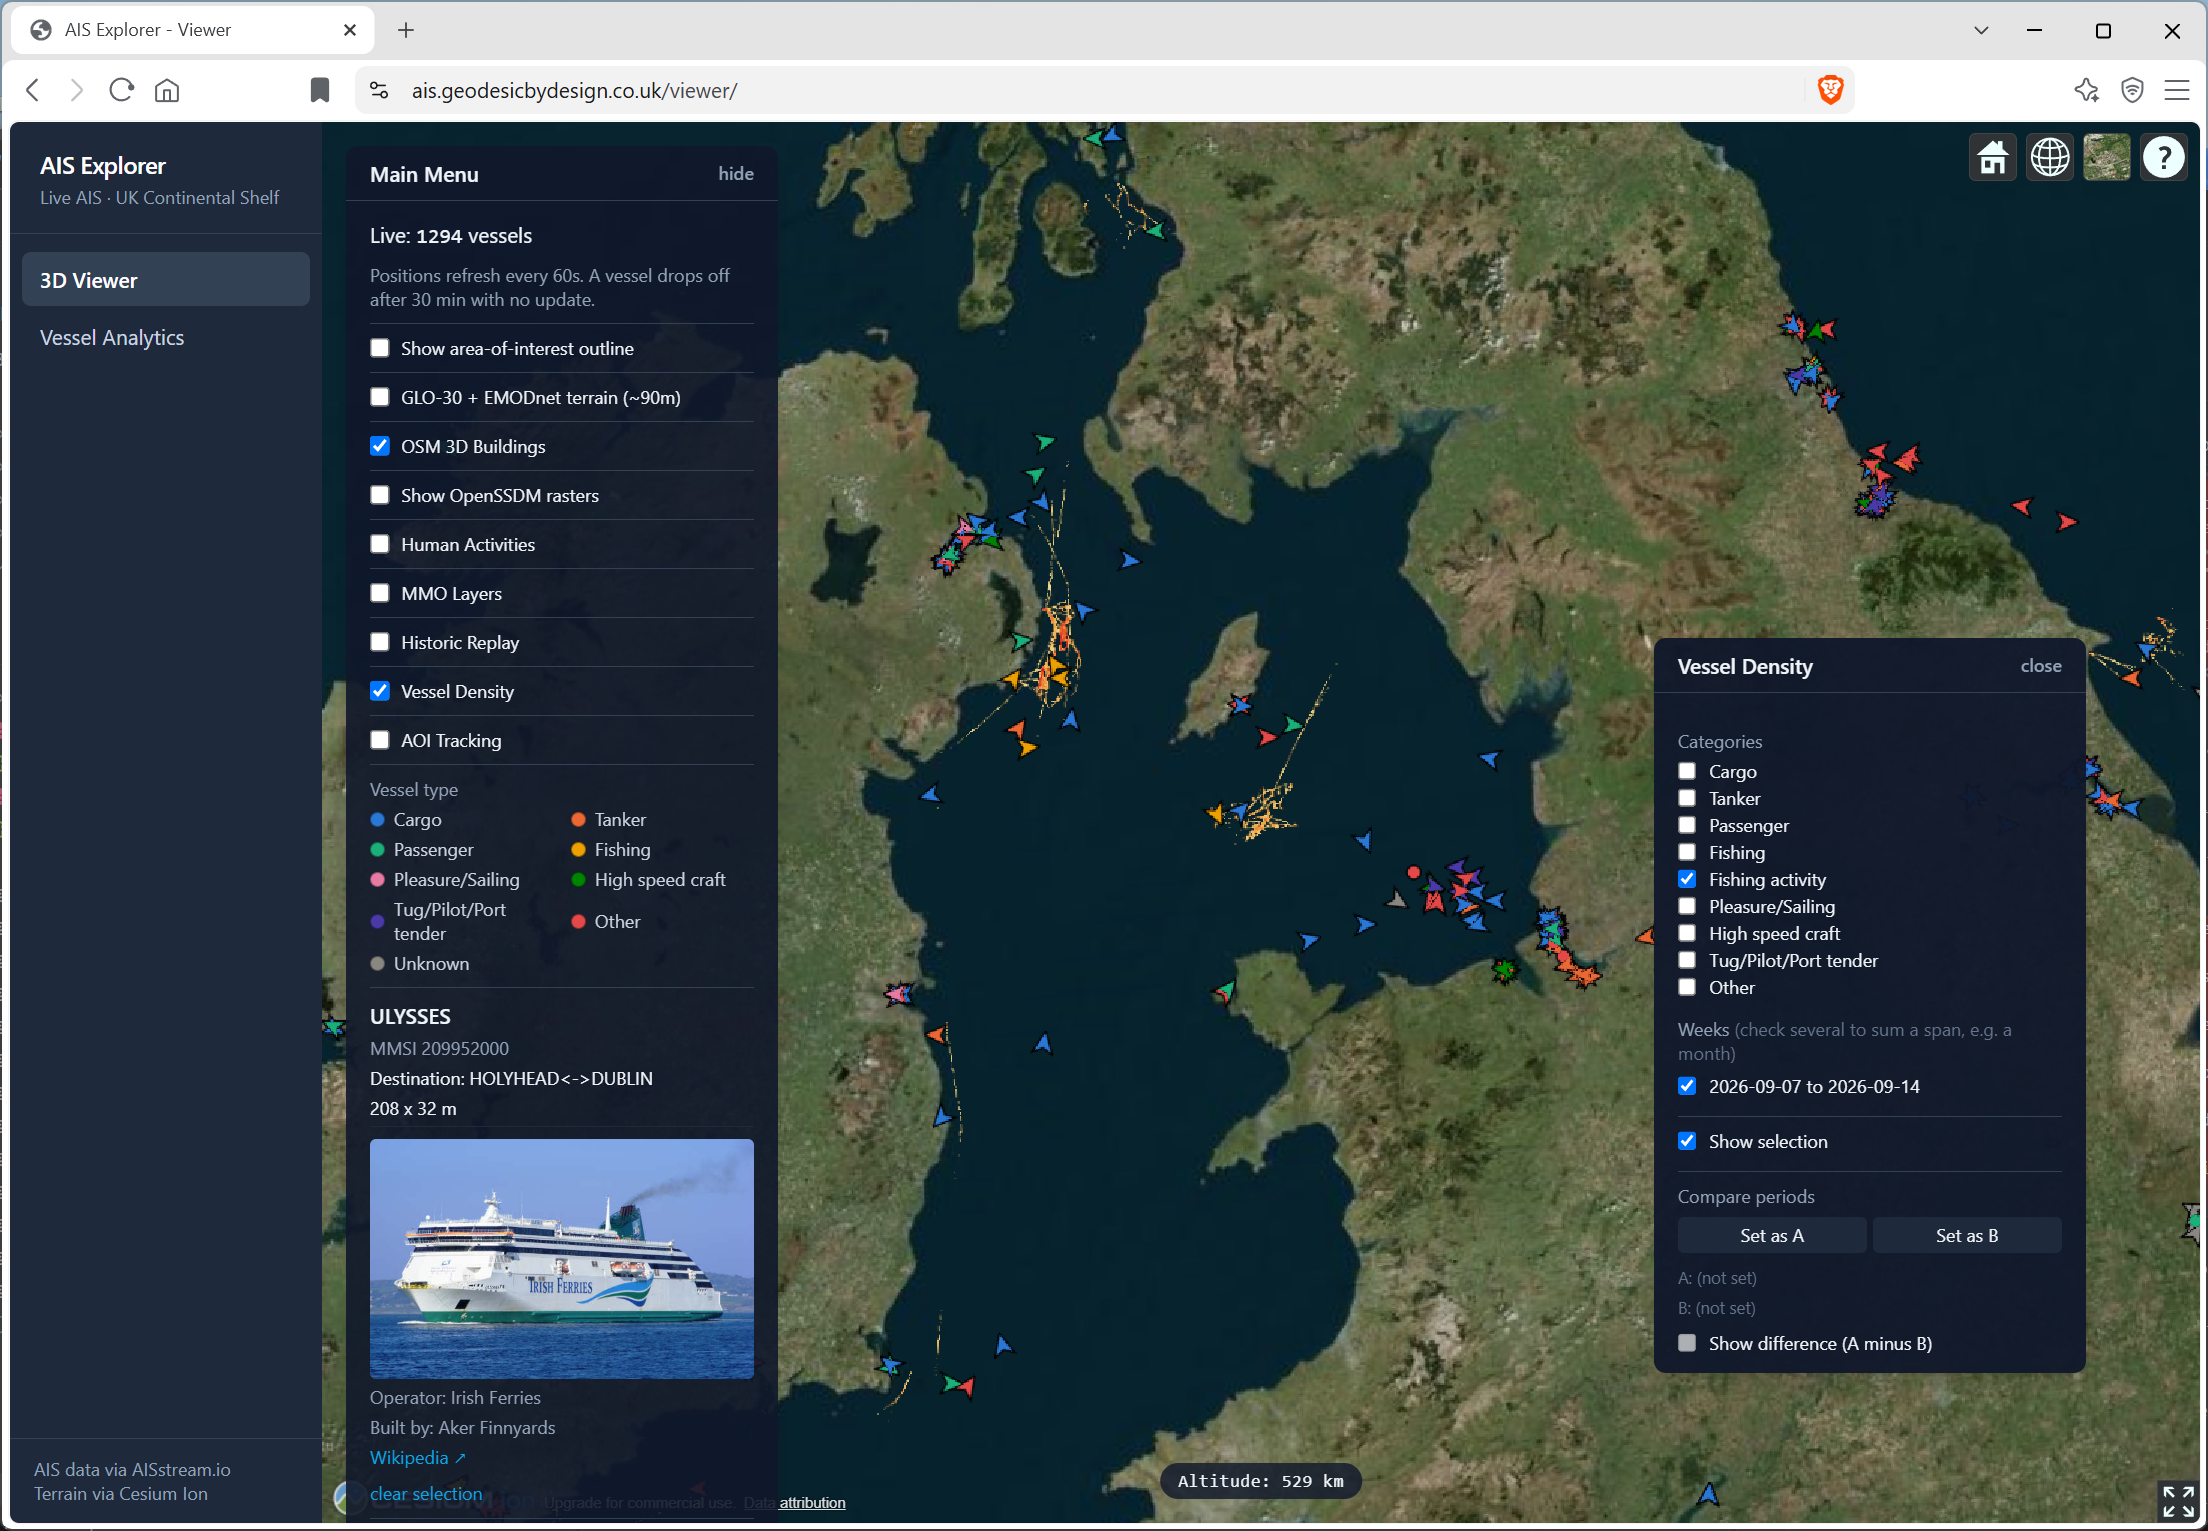
Vessel density by category
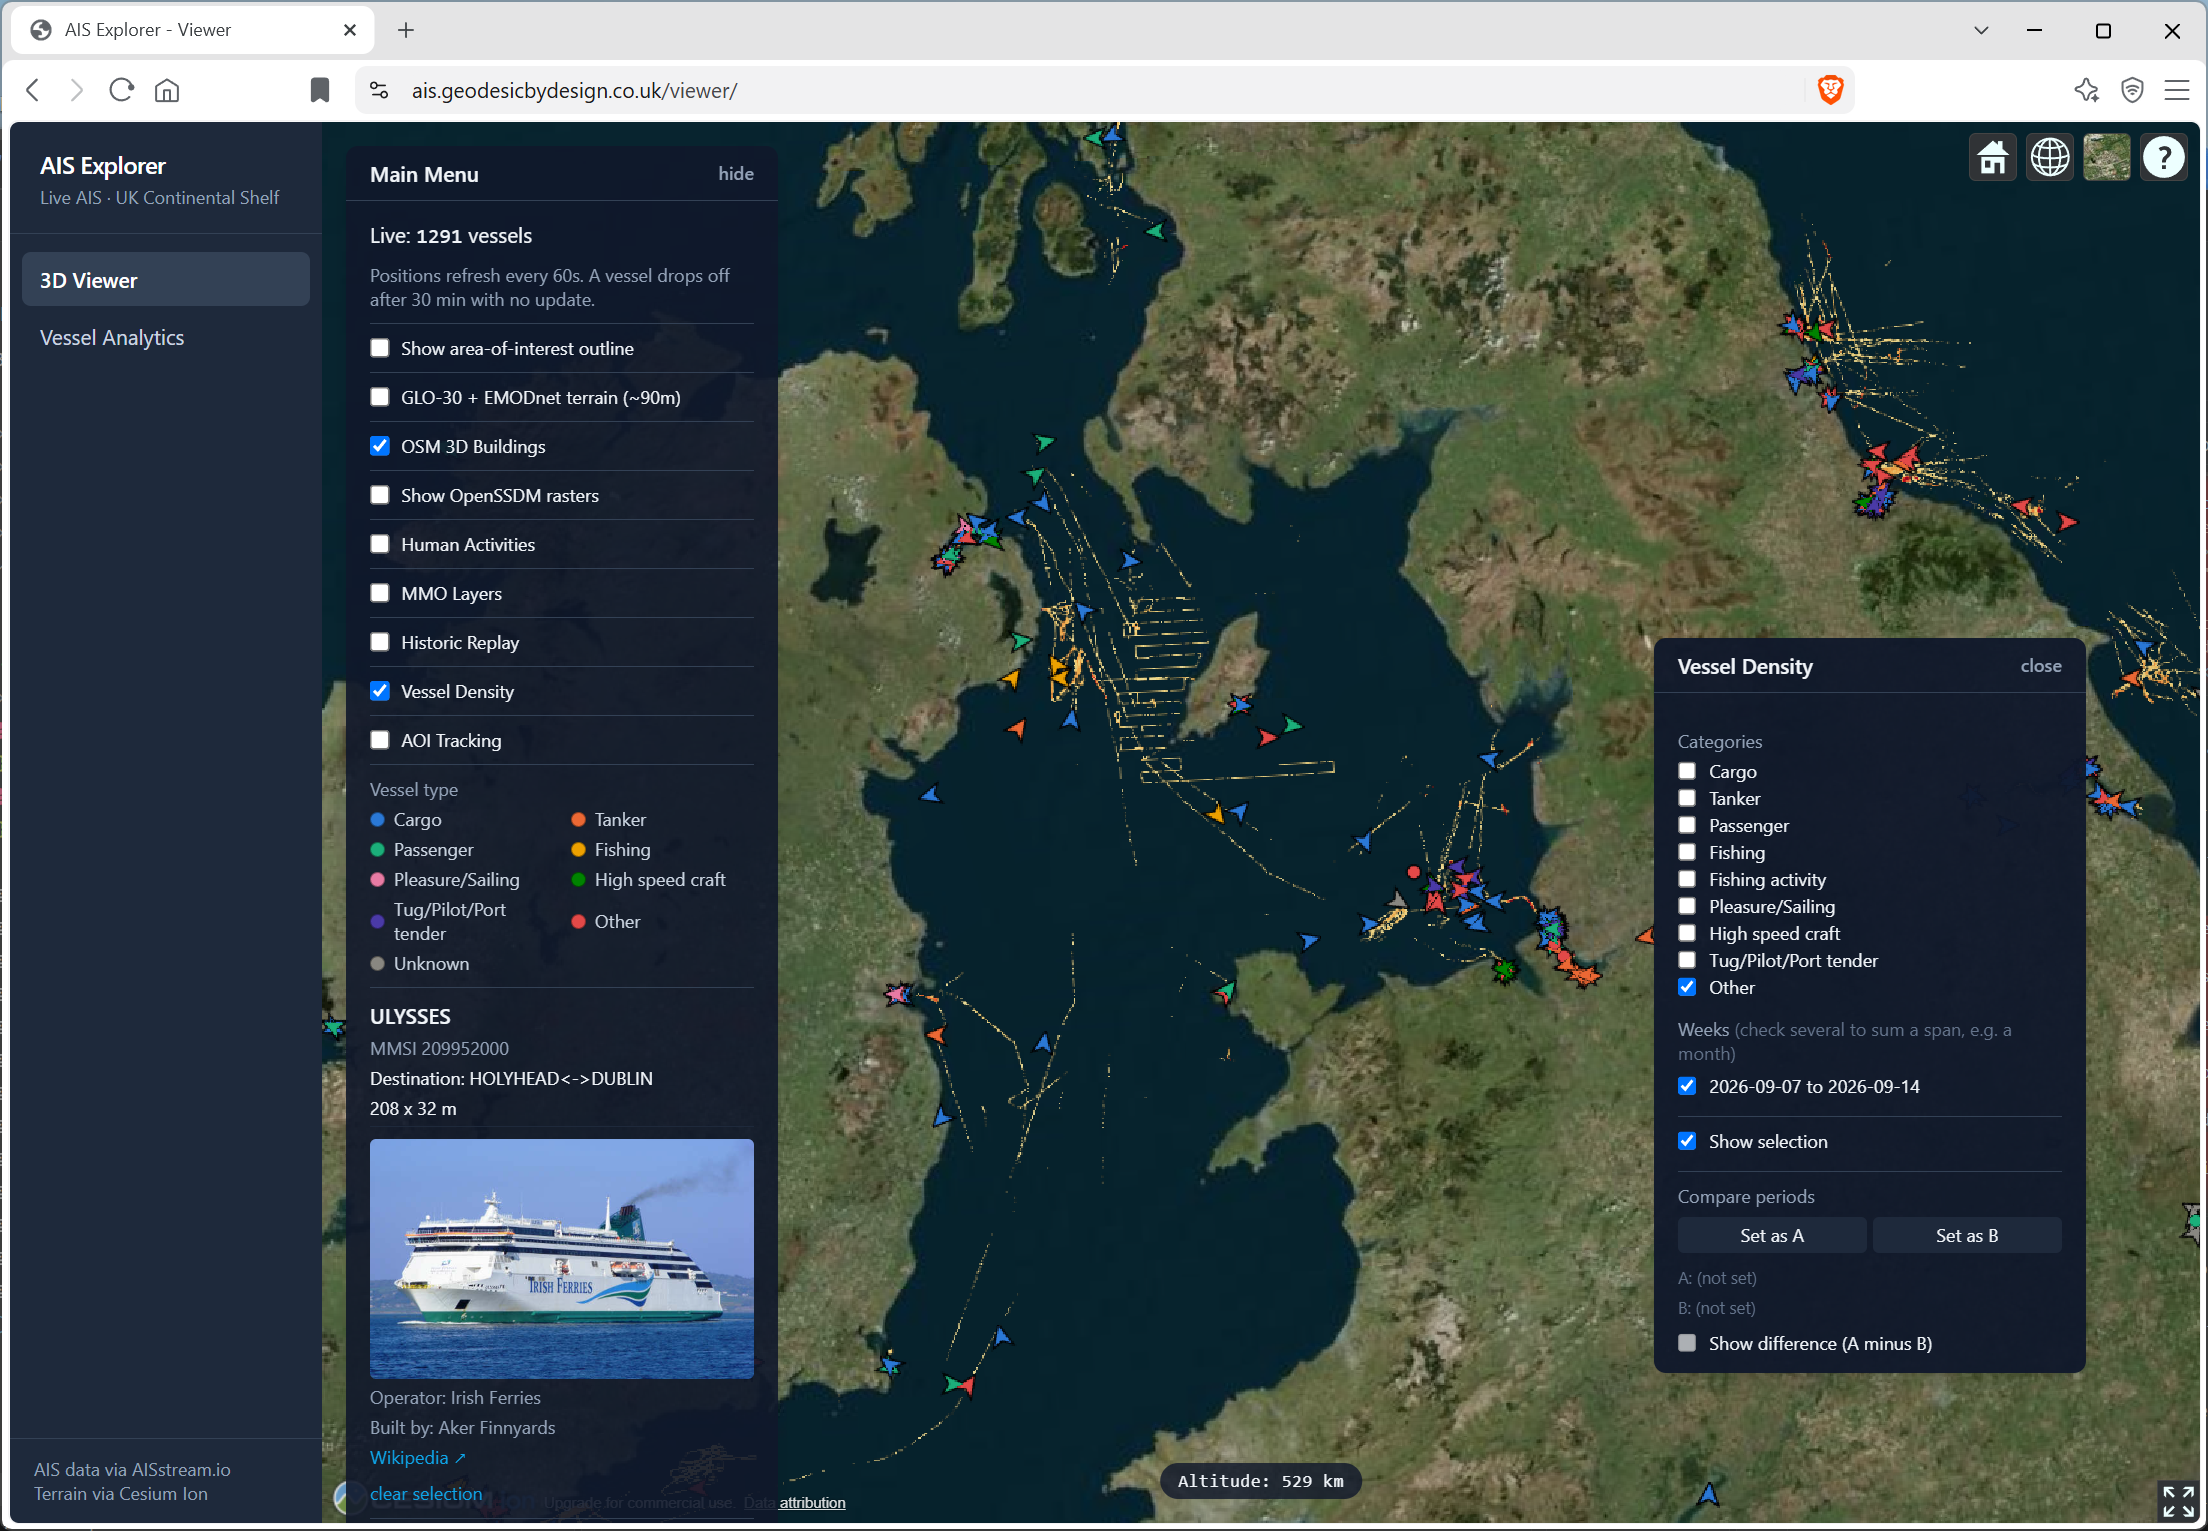
Live vessels are symbolised and filterable by class — cargo, tanker, passenger, fishing, and other traffic — and a vessel density heatmap can be filtered to the same categories over a chosen week (or several summed together), making it straightforward to isolate the activity that matters for a given question, whether that's commercial shipping lanes, fishing pressure, or passenger ferry routes.
Port visits
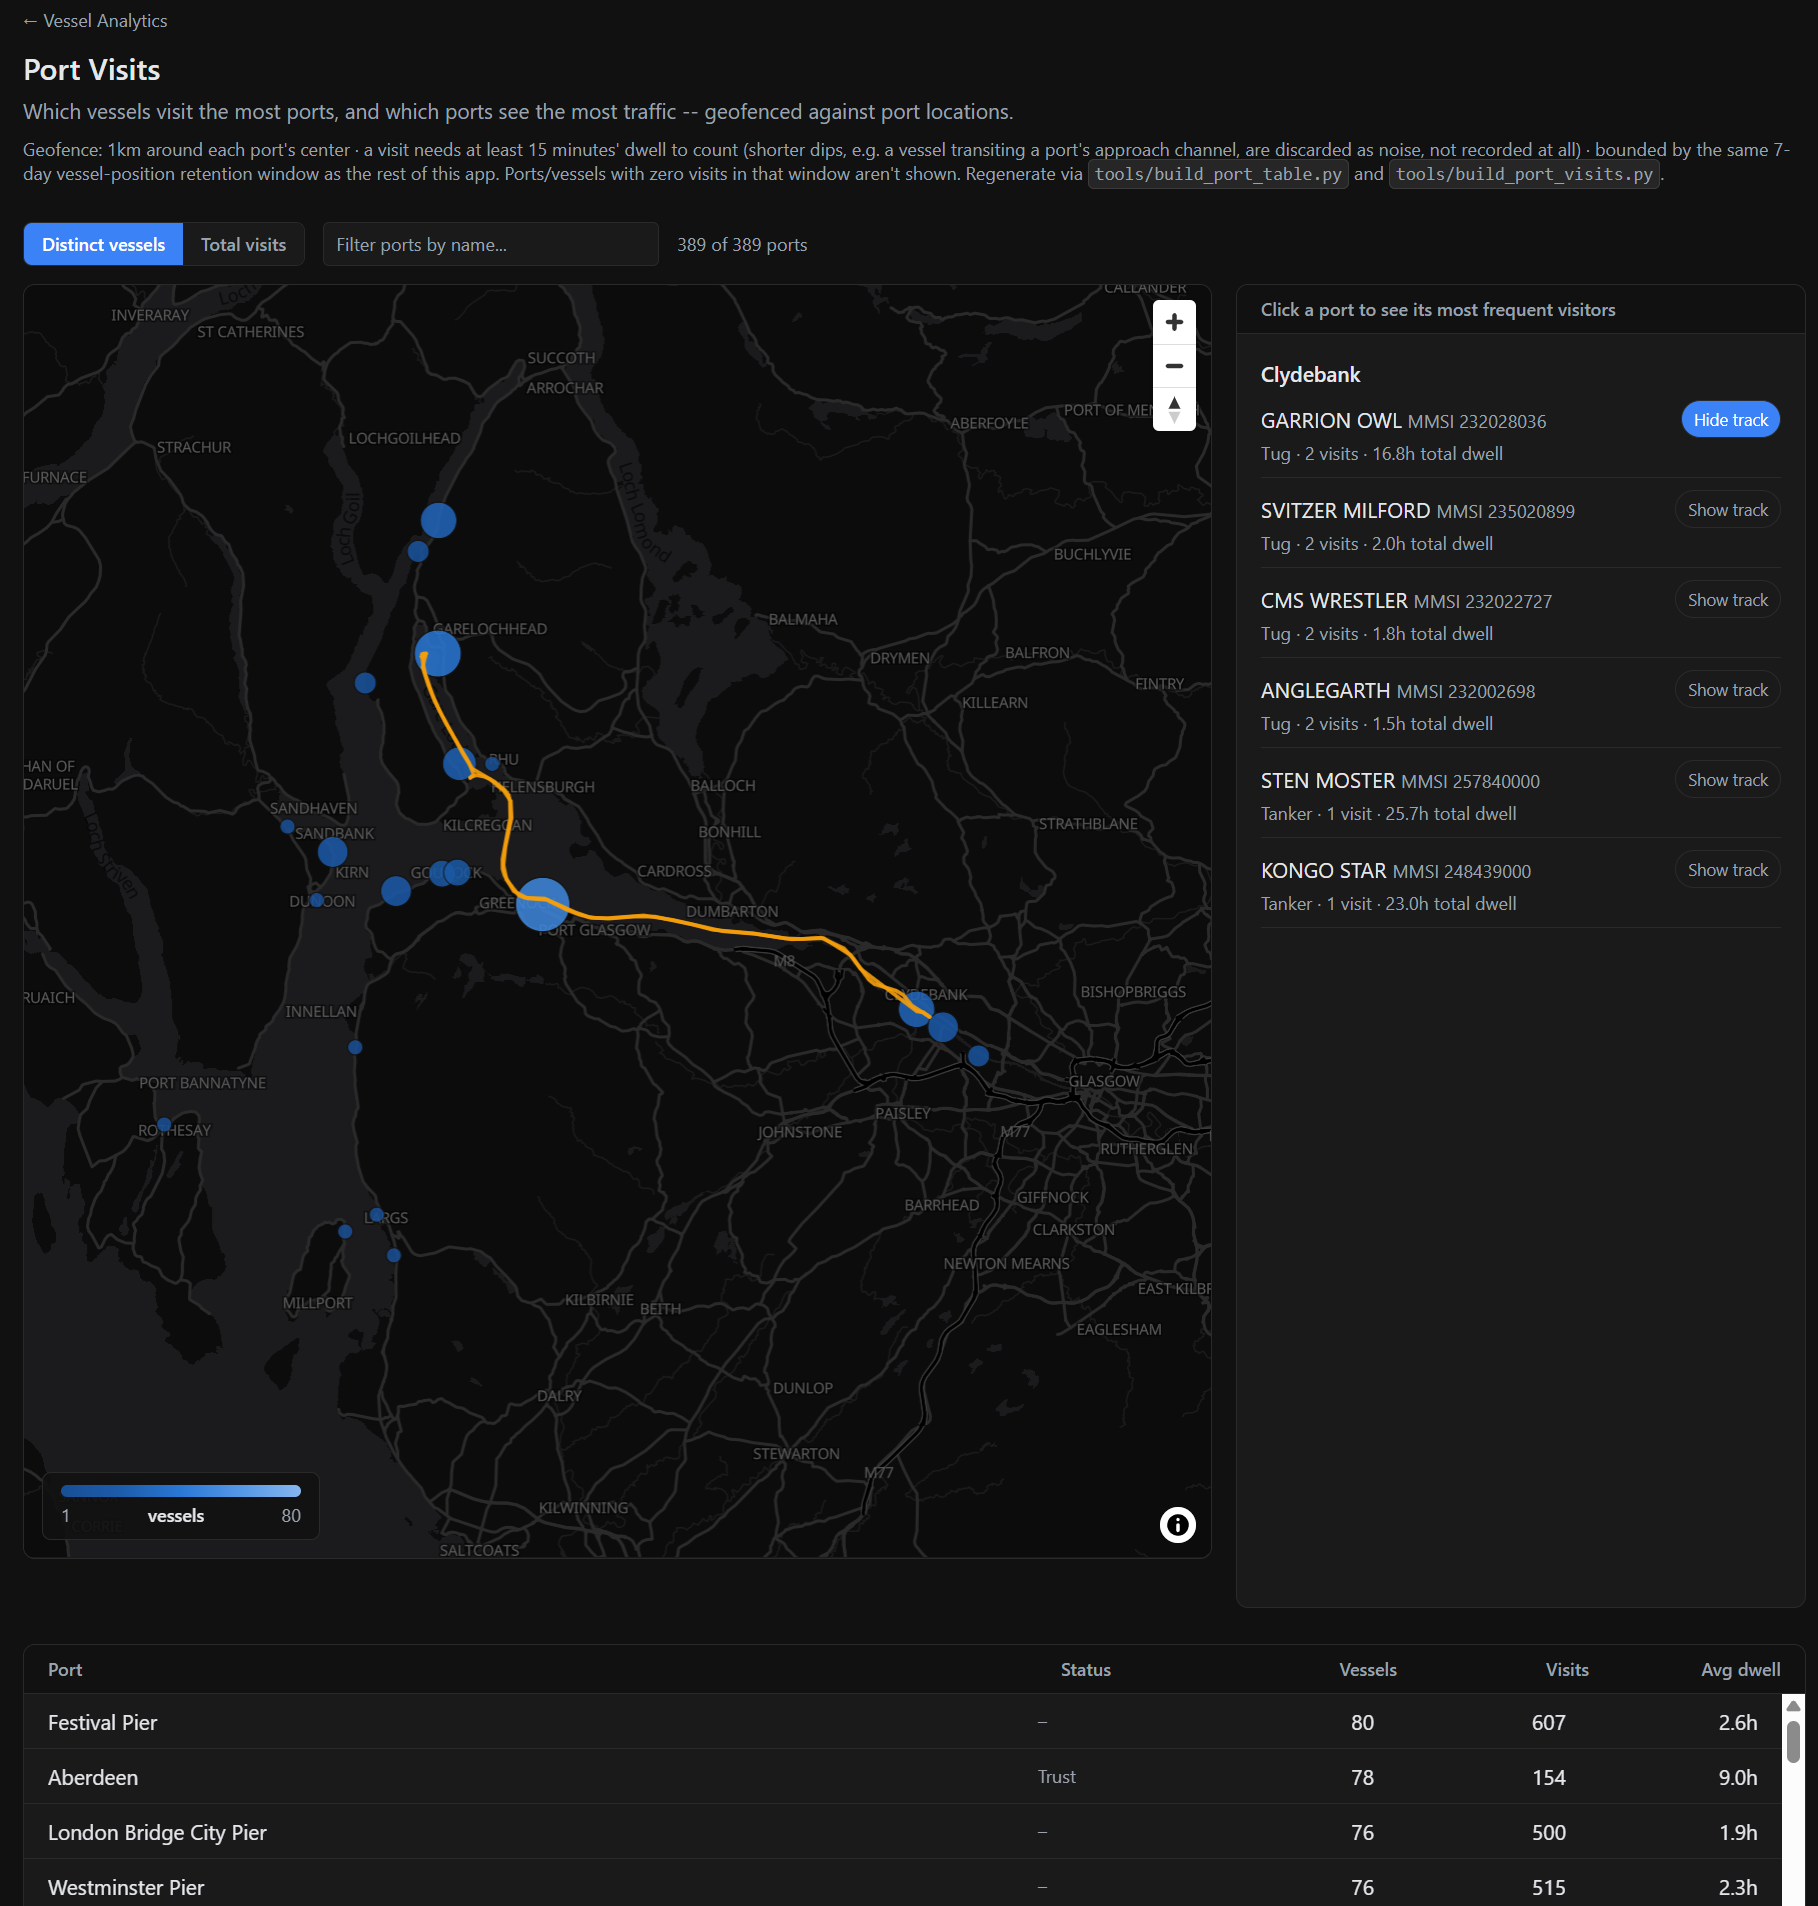
Port-visit analytics geofence vessel tracks against known port locations to surface which vessels call at which ports, how often, and for how long — click a port to see its most frequent visitors and their tracks.
Vessel leaderboards
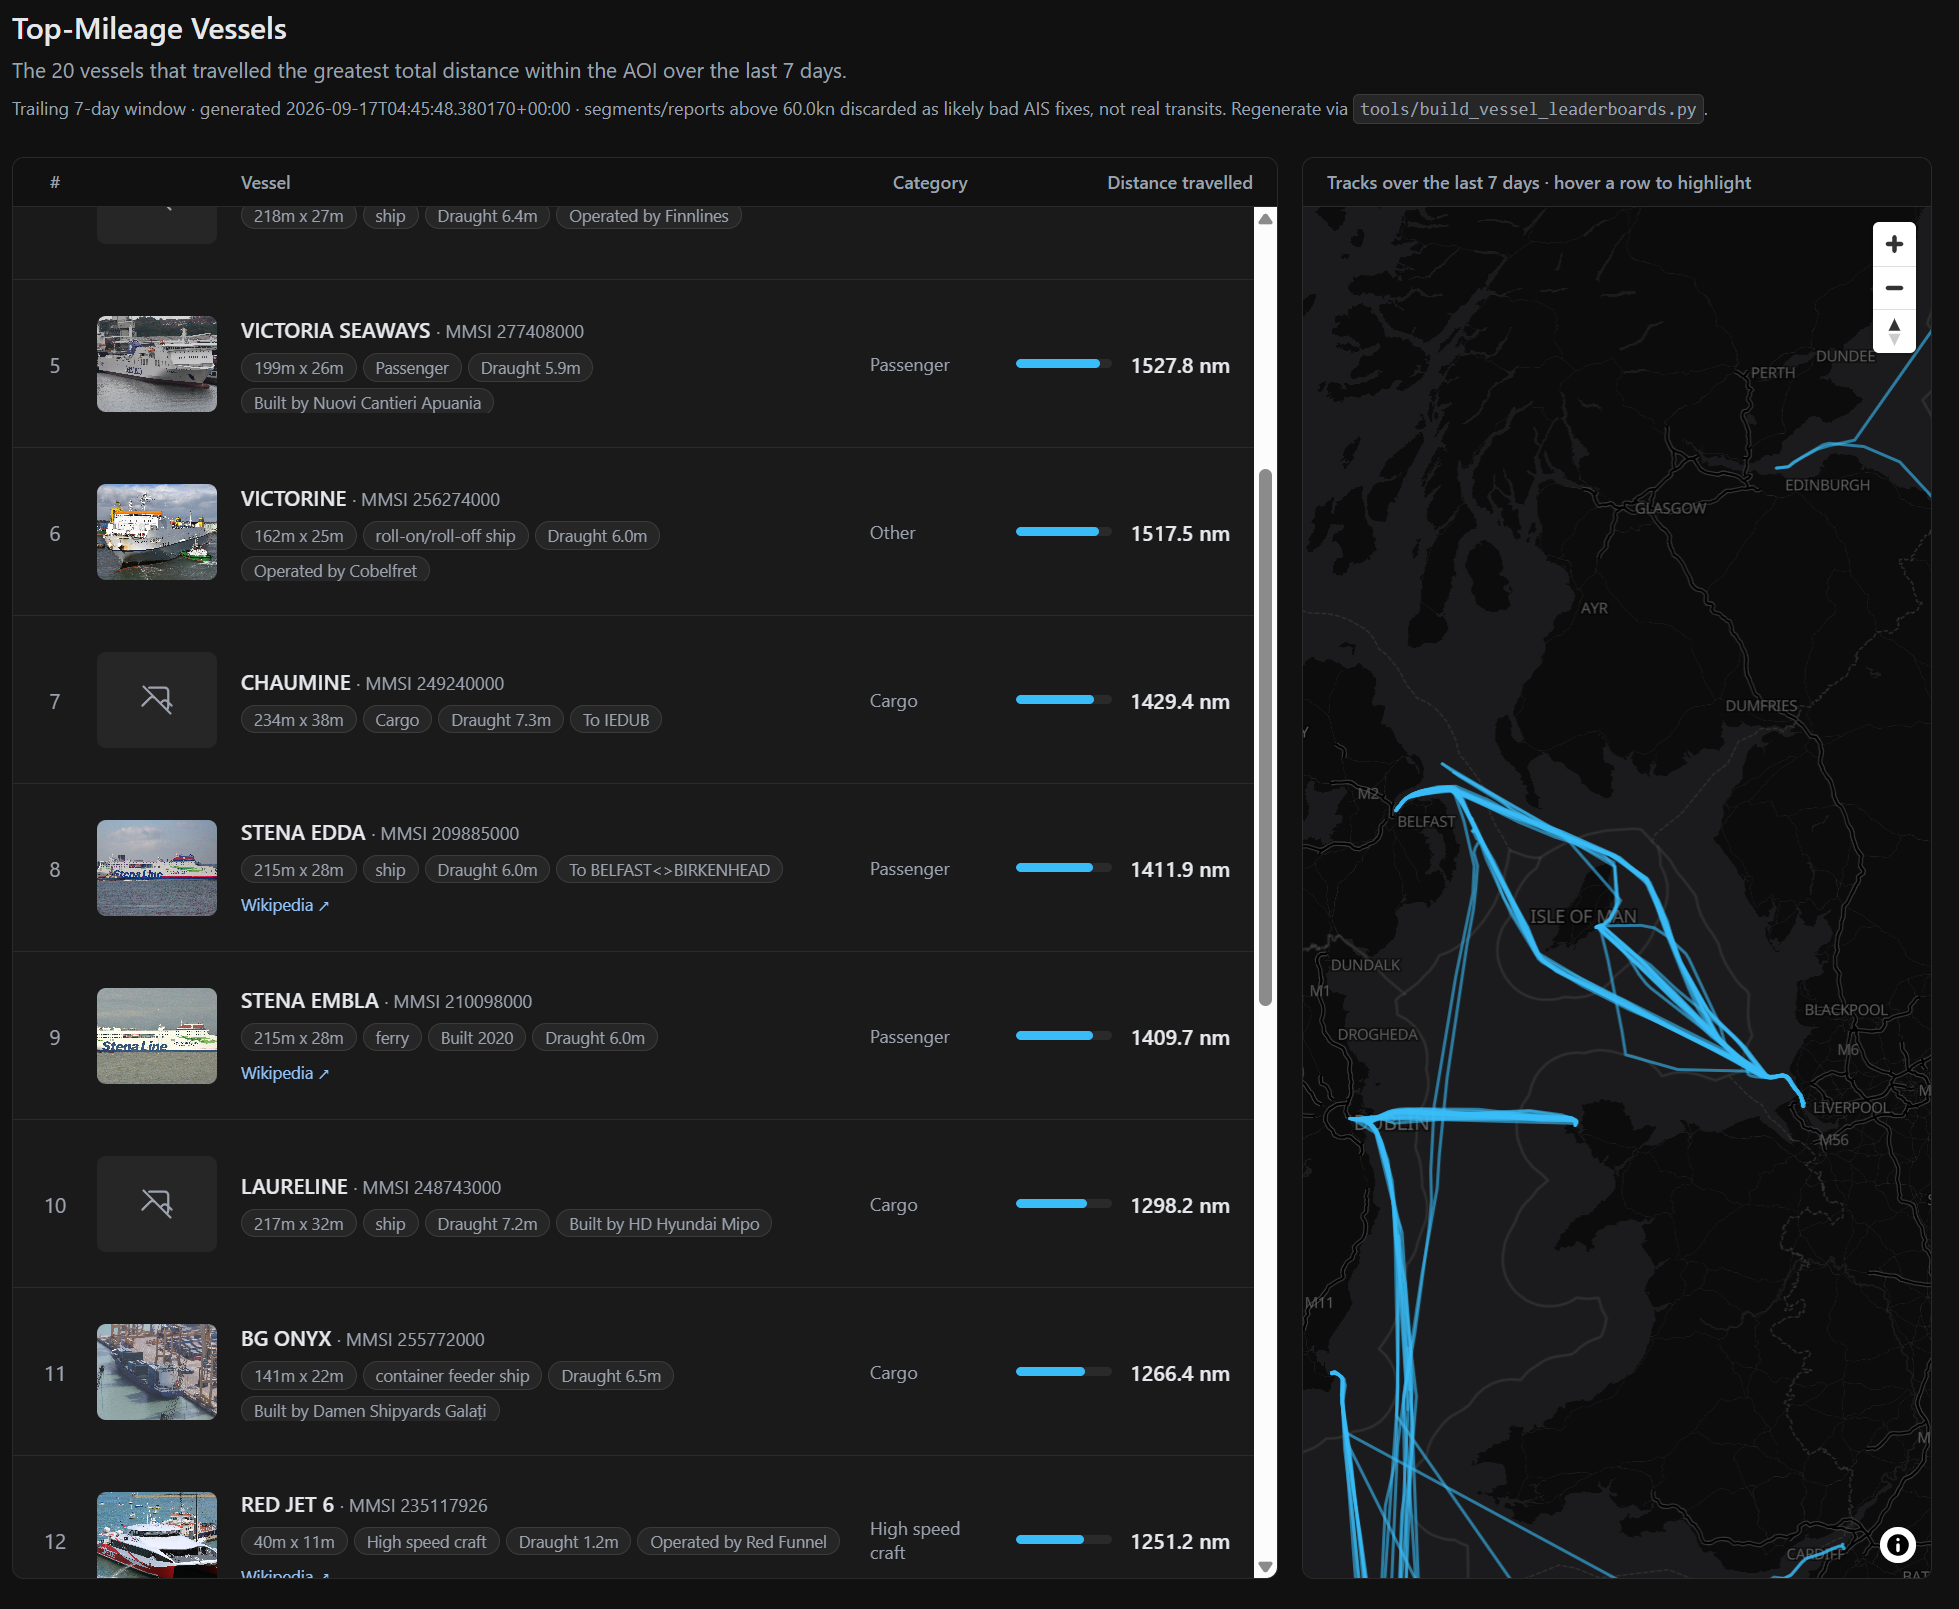
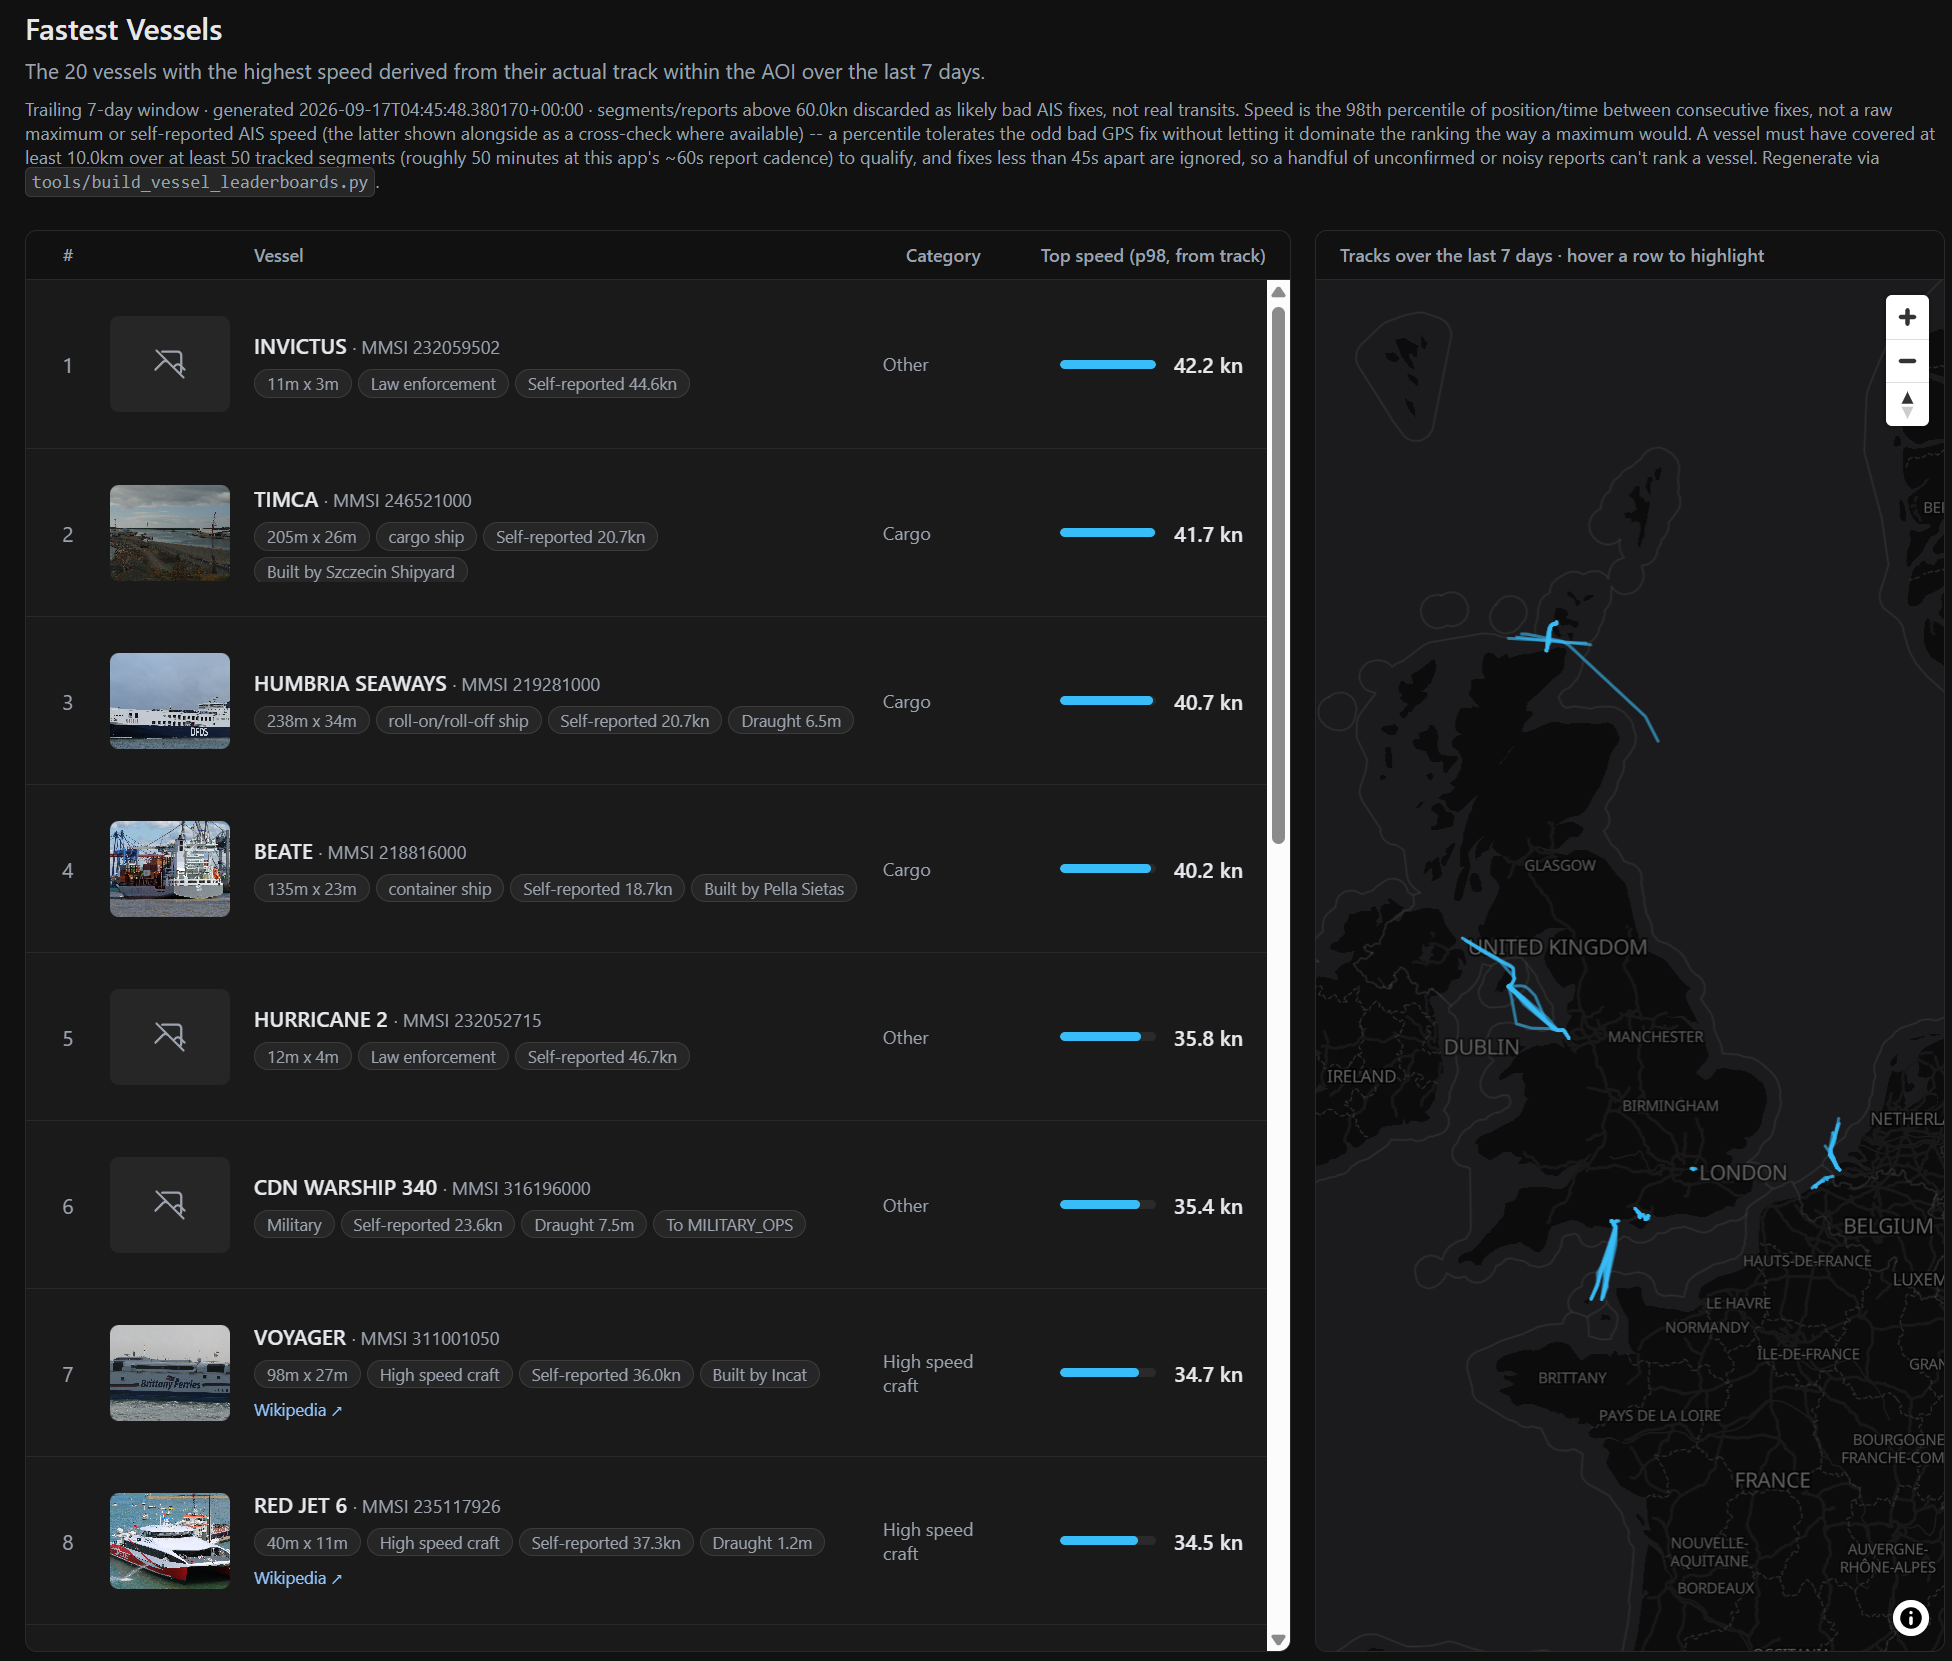
Rolling weekly leaderboards rank vessels by distance travelled and by top speed derived from their actual tracked positions, each paired with a map of the underlying tracks.
Live 3D Vessel Tracking
Real-time vessel positions streamed from the open AIS network and rendered on a Cesium 3D globe against real terrain and bathymetry, with historic track replay.
Seabed & Marine Overlays
OpenSSDM seabed survey rasters and EMODnet Human Activities layers — wind farms, cables, wrecks, boreholes and more — composited alongside the live traffic layer.
Port & Shipping Analytics
Scheduled analytics surface port visits, vessel density, and traffic leaderboards, turning live positions into a queryable record of maritime activity around the UK Continental Shelf.